Manufacturing intelligence · · 12 min read
Mexico manufacturing directory: 2026 industry and regional breakdown
656,617 manufacturing establishments, 39,790 with 11 or more employees, and where they are. An original analysis of Mexico's manufacturing base by industry, state, and size, with downloadable data.
Mexico's national business directory lists 656,617 manufacturing establishments. That headline number says little about where a U.S. buyer can actually source. Most of those establishments are bakeries, tortilla shops, and one-person workshops. The base that matters for most sourcing is far smaller, far more concentrated, and very unevenly spread across the country.
This report breaks Mexico's manufacturing base down by size, industry, and state, using INEGI's May 2026 directory release. It separates two things that are easy to confuse: how many establishments exist and what we've verified they can do.
- 656,617
- manufacturing establishments
- 39,790
- with 11 or more employees
- 5,093
- with 251 or more employees
- 50%
- of 11+ plants in the top five states
Most establishments are very small
Of the 656,617 establishments, 87.9% have five or fewer employees. Only 39,790 (6.1%) have 11 or more, and 5,093 have more than 250.
Share of Mexican manufacturing establishments with 11 or more employees
- Fewer than 11 employees616,827 · 93.9%
- 11 or more employees39,790 · 6.1%
The 39,790 establishments with 11+ employees, by size
Plants with more than 250 employees outnumber every range except 11–30.
View data ↓Hide data ↑
| Range | Value |
|---|---|
| 11–30 | 20,602 |
| 31–50 | 4,827 |
| 51–100 | 4,836 |
| 101–250 | 4,432 |
| 251+ | 5,093 |
The small end is not irrelevant. It includes specialized machine shops, embroidery workshops, and artisan producers that some buyers want. But for most programs, the 11+ segment is where suppliers with dedicated equipment, a quality process, and capacity for repeat orders are concentrated. The rest of this report focuses there unless noted.
Industries: food leads, then metal, plastics, and apparel
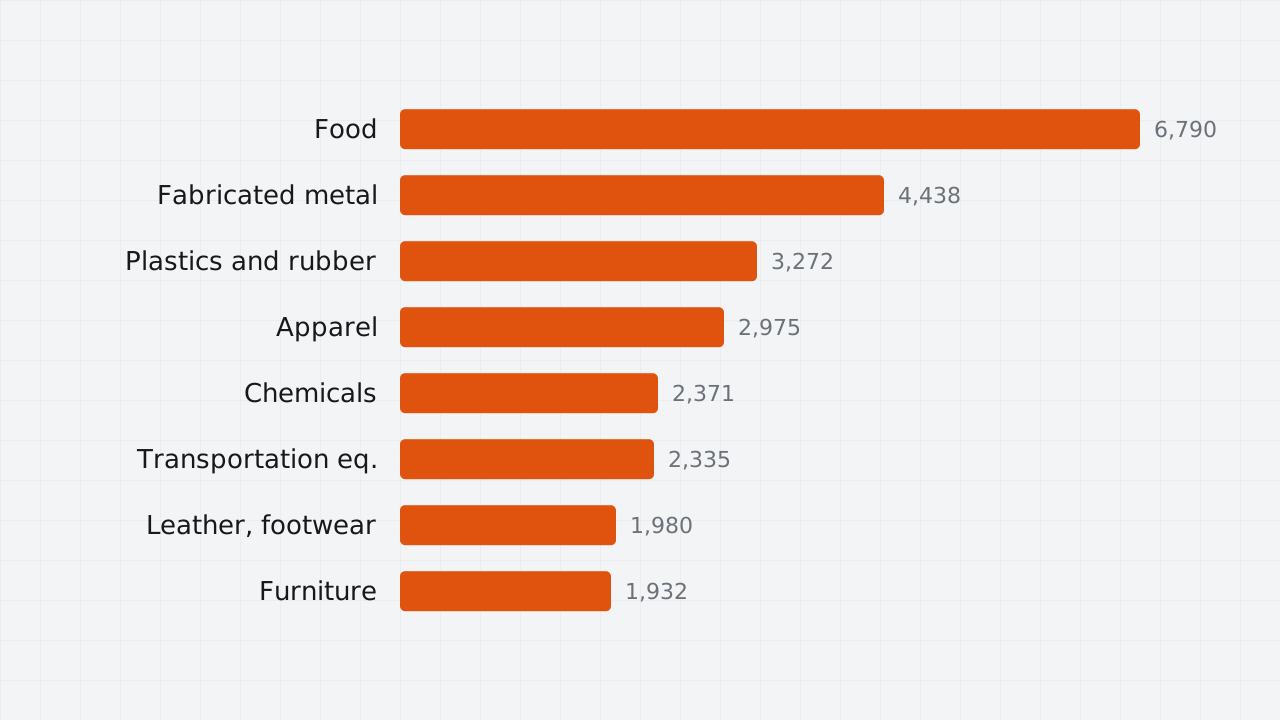
Among establishments with 11 or more employees, food is the largest industry (17.1%), followed by fabricated metal products (11.2%), plastics and rubber (8.2%), and apparel. Food leads because of the sheer number of mid-size processors, many of which serve the domestic market.
Establishments with 11+ employees, by industry
SCIAN subsectors (aligned with NAICS at this level).
- Food6,790
- Fabricated metal products4,438
- Plastics and rubber3,272
- Apparel2,975
- Chemicals2,371
- Transportation equipment2,335
- Leather and footwear1,980
- Furniture1,932
- Glass, ceramics, cement, and stone1,848
- Machinery1,738
- Miscellaneous (incl. medical devices)1,372
- Paper and packaging1,333
- Printing1,327
- Beverages and tobacco1,226
- Wood products1,163
- Primary metals827
- Electrical equipment and appliances771
- Computers and electronics719
- Textile mills657
- Textile products532
- Petroleum and coal products184
View data ↓Hide data ↑
| Industry | Establishments (11+) |
|---|---|
| Food | 6,790 |
| Fabricated metal products | 4,438 |
| Plastics and rubber | 3,272 |
| Apparel | 2,975 |
| Chemicals | 2,371 |
| Transportation equipment | 2,335 |
| Leather and footwear | 1,980 |
| Furniture | 1,932 |
| Glass, ceramics, cement, and stone | 1,848 |
| Machinery | 1,738 |
| Miscellaneous (incl. medical devices) | 1,372 |
| Paper and packaging | 1,333 |
| Printing | 1,327 |
| Beverages and tobacco | 1,226 |
| Wood products | 1,163 |
| Primary metals | 827 |
| Electrical equipment and appliances | 771 |
| Computers and electronics | 719 |
| Textile mills | 657 |
| Textile products | 532 |
| Petroleum and coal products | 184 |
Industries differ sharply in how much of their base is mid-size or larger:
- Computers and electronics: 72.2% of establishments have 11+ employees, and 54.2% have more than 50. This is an industry of large plants.
- Transportation equipment: 60.3% have 11+ employees, and 46.4% have more than 50.
- Plastics and rubber: 43.5% have 11+, an unusually high share for an industry with thousands of establishments.
- Fabricated metal products: only 5.6% have 11+. The industry is dominated by small workshops, including residential ironwork, even though it is the second-largest industry at the 11+ level.
Five states hold half the mid-size and larger plants
Estado de México, Jalisco, Guanajuato, Nuevo León, and Mexico City together hold 49.8% of all establishments with 11 or more employees.
Establishments with 11+ employees, top 15 states
- Estado de México4,356
- Jalisco4,178
- Guanajuato4,171
- Nuevo León3,817
- Mexico City3,276
- Puebla2,503
- Baja California1,996
- Querétaro1,525
- Chihuahua1,519
- Coahuila1,452
- Sonora998
- San Luis Potosí968
- Michoacán920
- Veracruz893
- Tamaulipas842
View data ↓Hide data ↑
| State | Establishments (11+) |
|---|---|
| Estado de México | 4,356 |
| Jalisco | 4,178 |
| Guanajuato | 4,171 |
| Nuevo León | 3,817 |
| Mexico City | 3,276 |
| Puebla | 2,503 |
| Baja California | 1,996 |
| Querétaro | 1,525 |
| Chihuahua | 1,519 |
| Coahuila | 1,452 |
| Sonora | 998 |
| San Luis Potosí | 968 |
| Michoacán | 920 |
| Veracruz | 893 |
| Tamaulipas | 842 |
But counting establishments of all sizes gives a misleading picture of where industrial capacity sits. Puebla has 60,624 manufacturing establishments, the second-highest total, but only 4.1% of them have 11 or more employees. Nuevo León has fewer than a third as many establishments in total, yet 22.2% are mid-size or larger, and it has more plants with over 250 employees (577) than any other state.
Share of each state's establishments with 11+ employees
How much of each state's manufacturing is mid-size or larger. National average: 6.1%.
- Nuevo León22.2%
- Baja California21.9%
- Querétaro17.1%
- Chihuahua15.3%
- Coahuila13.2%
- Aguascalientes12.5%
- Guanajuato12.0%
- Jalisco11.1%
- Mexico City10.1%
- Durango9.5%
- San Luis Potosí8.5%
- Tamaulipas8.2%
- Sonora7.6%
- Quintana Roo5.7%
- Estado de México5.7%
View data ↓Hide data ↑
| State | Share with 11+ employees |
|---|---|
| Nuevo León | 22.2% |
| Baja California | 21.9% |
| Querétaro | 17.1% |
| Chihuahua | 15.3% |
| Coahuila | 13.2% |
| Aguascalientes | 12.5% |
| Guanajuato | 12.0% |
| Jalisco | 11.1% |
| Mexico City | 10.1% |
| Durango | 9.5% |
| San Luis Potosí | 8.5% |
| Tamaulipas | 8.2% |
| Sonora | 7.6% |
| Quintana Roo | 5.7% |
| Estado de México | 5.7% |
The states with the highest share of mid-size and larger plants are the industrial north and the Bajío: Nuevo León (22.2%), Baja California (21.9%), Querétaro (17.1%), Chihuahua (15.3%), and Coahuila (13.2%), against a national average of 6.1%.
Each region has a specialty
Comparing each state's industry mix with the national mix shows what it's distinctively good at. The figure below is a location quotient: how many times more common an industry is among a state's 11+ plants than nationally.
| State | Most over-represented industry | Times the national share |
|---|---|---|
| Guanajuato | Leather and footwear | 7.5× |
| Puebla | Apparel | 5.2× |
| Baja California | Computers and electronics | 4.6× |
| Tamaulipas | Computers and electronics | 4.1× |
| Sonora | Computers and electronics | 3.9× |
| Chihuahua | Computers and electronics | 3.5× |
| Coahuila | Transportation equipment | 2.8× |
| Mexico City | Printing | 2.8× |
| Nuevo León | Primary metals | 2.6× |
| Querétaro | Transportation equipment | 2.2× |
| Jalisco | Furniture | 1.8× |
Four of the six states bordering the U.S. have electronics as their strongest specialty. Explore every state in the interactive map.
What establishment counts can't tell you
A directory count says an establishment exists, what its main activity is, and roughly how many people work there. It doesn't say what the plant can make, to what tolerances, under which certifications, or whether it takes orders from outside companies.
That's the gap our research layer fills. So far we have:
- 10,803
- company websites verified
- 822
- profiles researched with quoted evidence
- 73%
- of researched profiles take outside orders
- 183
- document ISO 9001 on their site
These researched profiles are a working sample, not a statistical one: our research has started with job shops and contract manufacturers, so the share taking outside orders is higher than it would be for manufacturing as a whole. We report it to show what verification adds, not as a national estimate.
Download the data · CSV · free to use with attribution
- Download
Manufacturing by state
32 states · all sizes, 11+ and 251+ employees, national share
- Download
Manufacturing by state and industry
State × 21 SCIAN subsectors · establishments with 11+ employees
- Download
U.S.–Mexico coverage by industry
21 subsectors · U.S. (CBP 2023) and Mexico (DENUE 2026) establishment counts
Methodology and limitations
Source. Establishment counts come from INEGI's Directorio Estadístico Nacional de Unidades Económicas (DENUE), May 20, 2026 release, manufacturing sectors 31–33. DENUE lists active economic units by location, main activity (SCIAN 2018), and employee range.
Size. Employee counts are reported in ranges (0–5, 6–10, 11–30, 31–50, 51–100, 101–250, 251+). "11+" means the 11–30 range and above.
Industries. Industries are SCIAN three-digit subsectors, which align closely with U.S. NAICS subsectors. Each establishment is counted once, under its main activity; a plant that also does secondary processes is counted only under its primary one.
Establishments, not companies. A company with several plants appears once per plant. Warehouses or offices registered under a manufacturing activity can appear in the data.
Researched profiles. Figures on verified websites and capabilities come from Agalma Sourcing's ongoing research, in which every capability is backed by a quote from the company's own website. The sample is not random and will change as research continues.
How to cite. Agalma Sourcing, "Mexico Manufacturing Directory: 2026 Industry and Regional Breakdown," October 2026, based on INEGI DENUE (May 2026).
Find manufacturers in any industry or state
Free, no account. You'll see named manufacturers and why each one matched.
More from the blog