Manufacturing intelligence · · 8 min read
U.S.–Mexico manufacturing: supplier coverage by industry
Mexico has about 30 mid-size and larger factories for every 100 in the U.S. Industry by industry, where its supplier base is relatively deep, where it's thin, and what that means for nearshoring.
If you're moving production to Mexico, the first question is whether Mexico has enough suppliers in your industry. This report compares the number of mid-size and larger manufacturing establishments in the two countries, industry by industry, using each country's official establishment data.
- 132,851
- U.S. manufacturing establishments with 10+ employees
- 39,790
- Mexican establishments with 11+ employees
- 30%
- Mexico's count relative to the U.S.
- 21
- industries compared (NAICS/SCIAN subsectors)
The headline: about 30 Mexican plants per 100 U.S. plants
The U.S. has 132,851 manufacturing establishments with 10 or more employees (Census County Business Patterns, 2023). Mexico has 39,790 with 11 or more (INEGI DENUE, May 2026). Overall, Mexico has about 30 mid-size and larger plants for every 100 in the U.S.
That ratio varies enormously by industry.
Mexican establishments per 100 U.S. establishments, by industry
Mexico 11+ employees vs. U.S. 10+ employees. Highlighted: industries where Mexico has more plants than the U.S.
- Leather and footwear576
- Apparel254
- Textile mills73
- Food46
- Paper and packaging43
- Plastics and rubber41
- Furniture39
- Textile products35
- Transportation equipment33
- Primary metals32
- Chemicals28
- Electrical equipment and appliances26
- Glass, ceramics, cement, and stone24
- Beverages and tobacco23
- Petroleum and coal products21
- Printing20
- Miscellaneous (incl. medical devices)20
- Fabricated metal products18
- Wood products17
- Machinery15
- Computers and electronics12
View data ↓Hide data ↑
| Industry | Mexican plants per 100 U.S. plants |
|---|---|
| Leather and footwear | 576 |
| Apparel | 254 |
| Textile mills | 73 |
| Food | 46 |
| Paper and packaging | 43 |
| Plastics and rubber | 41 |
| Furniture | 39 |
| Textile products | 35 |
| Transportation equipment | 33 |
| Primary metals | 32 |
| Chemicals | 28 |
| Electrical equipment and appliances | 26 |
| Glass, ceramics, cement, and stone | 24 |
| Beverages and tobacco | 23 |
| Petroleum and coal products | 21 |
| Printing | 20 |
| Miscellaneous (incl. medical devices) | 20 |
| Fabricated metal products | 18 |
| Wood products | 17 |
| Machinery | 15 |
| Computers and electronics | 12 |
In two industries, Mexico has more mid-size and larger plants than the U.S.: leather and footwear (576 Mexican plants per 100 U.S. plants) and apparel (254). In textile mills it's 73. At the other end, Mexico has 15 machinery plants and 12 computer and electronics plants for every 100 in the U.S.
Where Mexico's base is relatively deeper or thinner
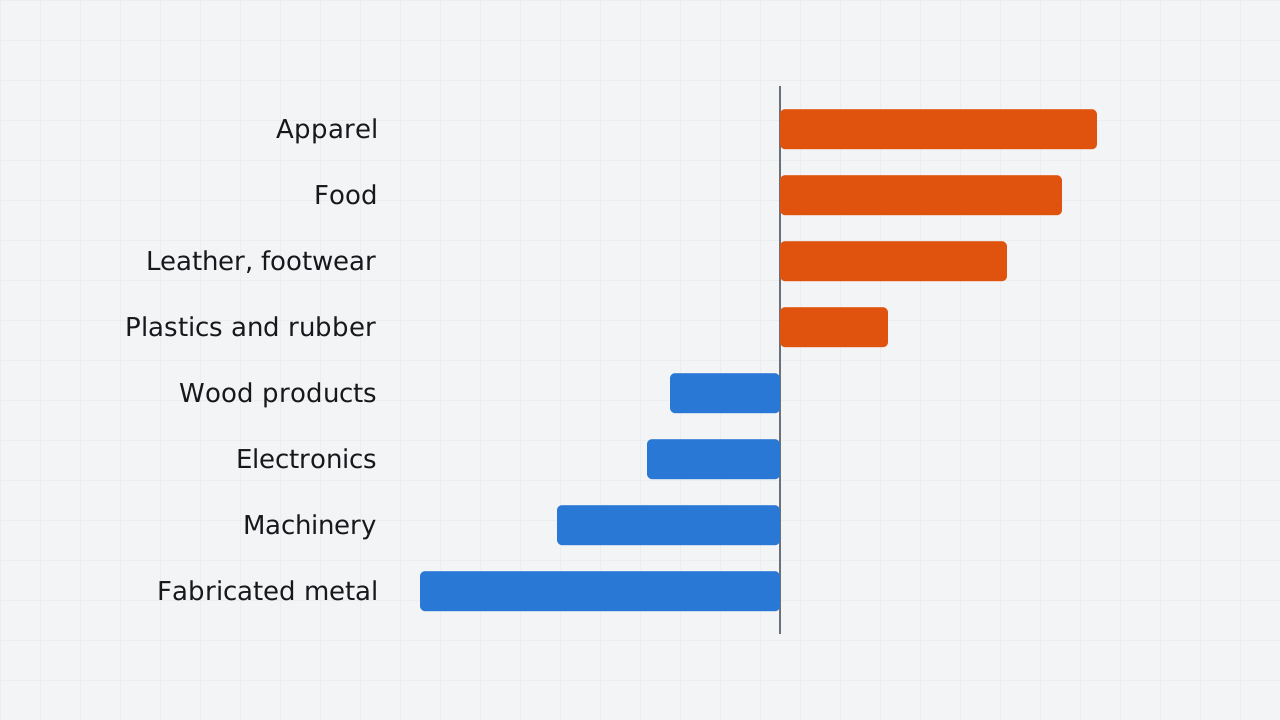
Raw counts favor the larger economy everywhere. A fairer comparison is each industry's share of its own country's manufacturing base: where Mexico's base is weighted more heavily than the U.S.'s, and where it is weighted less.
Where Mexico's supplier base is relatively deeper or thinner than the U.S.
Each industry's share of mid-size and larger establishments in Mexico (11+ employees) minus its share in the U.S. (10+), in percentage points.
- Apparel
- Food
- Leather and footwear
- Plastics and rubber
- Furniture
- Paper and packaging
- Textile mills
- Transportation equipment
- Textile products
- Primary metals
- Petroleum and coal products
- Electrical equipment and appliances
- Chemicals
- Beverages and tobacco
- Glass, ceramics, cement, and stone
- Printing
- Miscellaneous (incl. medical devices)
- Wood products
- Computers and electronics
- Machinery
- Fabricated metal products
View data ↓Hide data ↑
| Industry | U.S. (10+) | Mexico (11+) | U.S. share | Mexico share |
|---|---|---|---|---|
| Apparel | 1,172 | 2,975 | 0.9% | 7.5% |
| Food | 14,861 | 6,790 | 11.2% | 17.1% |
| Leather and footwear | 344 | 1,980 | 0.3% | 5.0% |
| Plastics and rubber | 7,916 | 3,272 | 6.0% | 8.2% |
| Furniture | 4,962 | 1,932 | 3.7% | 4.9% |
| Paper and packaging | 3,069 | 1,333 | 2.3% | 3.4% |
| Textile mills | 900 | 657 | 0.7% | 1.7% |
| Transportation equipment | 7,121 | 2,335 | 5.4% | 5.9% |
| Textile products | 1,504 | 532 | 1.1% | 1.3% |
| Primary metals | 2,559 | 827 | 1.9% | 2.1% |
| Petroleum and coal products | 886 | 184 | 0.7% | 0.5% |
| Electrical equipment and appliances | 3,020 | 771 | 2.3% | 1.9% |
| Chemicals | 8,416 | 2,371 | 6.3% | 6.0% |
| Beverages and tobacco | 5,378 | 1,226 | 4.0% | 3.1% |
| Glass, ceramics, cement, and stone | 7,577 | 1,848 | 5.7% | 4.6% |
| Printing | 6,524 | 1,327 | 4.9% | 3.3% |
| Miscellaneous (incl. medical devices) | 6,866 | 1,372 | 5.2% | 3.5% |
| Wood products | 6,941 | 1,163 | 5.2% | 2.9% |
| Computers and electronics | 6,081 | 719 | 4.6% | 1.8% |
| Machinery | 11,981 | 1,738 | 9.0% | 4.4% |
| Fabricated metal products | 24,773 | 4,438 | 18.6% | 11.2% |
Relatively deeper in Mexico:
- Apparel: 7.5% of Mexico's mid-size and larger plants, against 0.9% in the U.S.
- Food: 17.1% against 11.2%
- Leather and footwear: 5.0% against 0.3%
- Plastics and rubber: 8.2% against 6.0%
- Furniture, paper and packaging, and textile mills: each about one percentage point higher
Relatively thinner in Mexico:
- Fabricated metal products: 11.2% against 18.6%
- Machinery: 4.4% against 9.0%
- Computers and electronics: 1.8% against 4.6%
- Wood products, printing, and miscellaneous manufacturing (including medical devices): each 1.6 to 2.3 points lower
Counts are not capacity
Establishment counts measure how many plants exist, not how much they produce. Two industries show why that matters:
- Computers and electronics look thin by count, but 54.2% of Mexico's computer and electronics establishments have more than 50 employees. The industry is concentrated in fewer, much larger plants, many of them at the border. See Mexico's electronics manufacturing clusters.
- Transportation equipment has a share close to the U.S. (5.9% against 5.4%), but 46.4% of Mexican transportation equipment establishments have more than 50 employees. See where Mexico's automotive suppliers are.
What this means for nearshoring
- Apparel, footwear, plastics, packaging, and furniture have a relatively deep base of mid-size suppliers. Expect plenty of choice and competitive quotes.
- Machining, fabrication, and machinery have a thinner base relative to the U.S., though still thousands of plants in absolute terms, concentrated in Nuevo León, Estado de México, and Jalisco. Shortlisting carefully matters more.
- Electronics and automotive are concentrated in large plants and specific corridors. The capacity is there, but it sits with fewer suppliers, many of them running large programs.
Download the data · CSV · free to use with attribution
- Download
U.S.–Mexico coverage by industry
21 subsectors · U.S. (CBP 2023) and Mexico (DENUE 2026) establishment counts
Methodology and limitations
Sources. U.S.: Census Bureau County Business Patterns 2023, national file, all legal forms, by NAICS three-digit subsector. Mexico: INEGI DENUE, May 2026 release, by SCIAN three-digit subsector. SCIAN and NAICS align at the three-digit level.
Size thresholds differ slightly. CBP reports establishments with 10 or more employees; DENUE's nearest range starts at 11. We compare those segments rather than totals, because the two sources treat very small establishments differently: CBP covers establishments with paid employees, while DENUE includes micro units of every kind.
Shares. Each industry's share is its count divided by the country's total in the same size segment. Differences are in percentage points.
Data years. The U.S. data is for 2023 and the Mexican data is from 2026. Both change slowly at this level, but the comparison is not for a single point in time.
How to cite. Agalma Sourcing, "U.S.–Mexico Manufacturing: Supplier Coverage by Industry," October 2026, based on U.S. Census CBP 2023 and INEGI DENUE (May 2026).
Find Mexican suppliers in your industry
Free, no account. You'll see named manufacturers and why each one matched.
More from the blog